Zonda Live
UX/UI CASE STUDY
Housing industry data and lead information

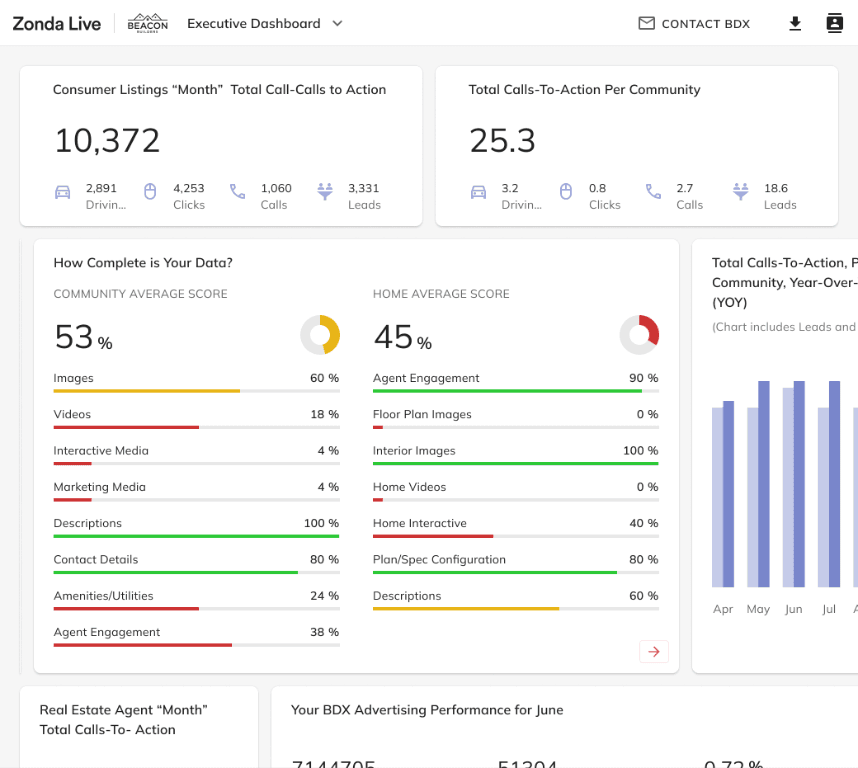
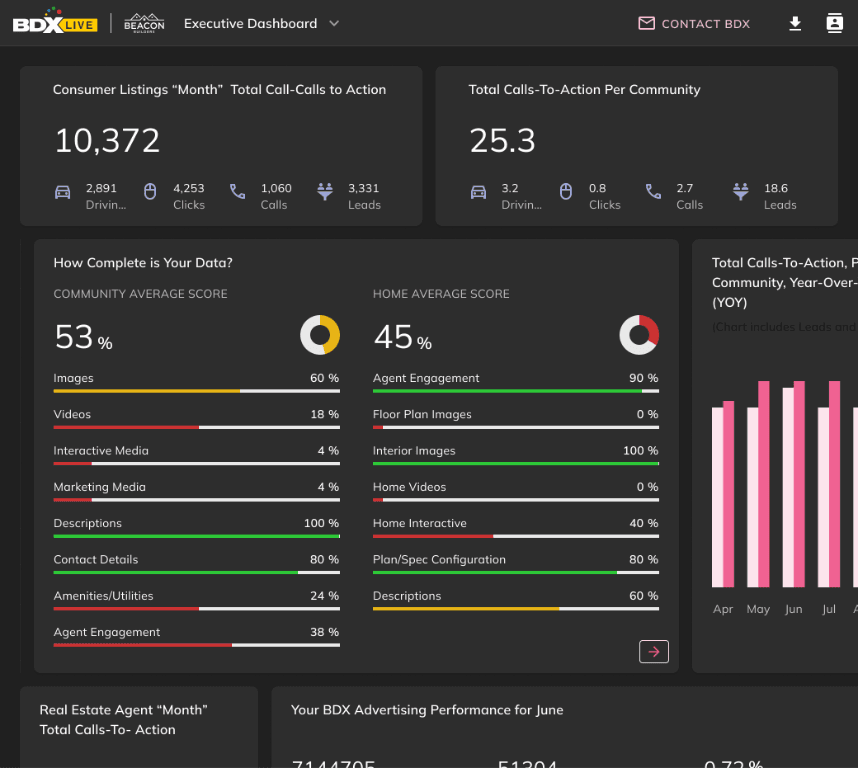
Dashboard screens
Problem
Overwhelming dense dashboards, poor hierarchy, inconsistent UI, steep learning curve.

Solution
Dashboard redesign, improved visuals, lead UI, filters & reporting tools
Timeline:1 Year
- Research & Audit1
- Define Goals & Users2
- Ideation3
- Wireframing4
- Design System5
- Testing & Refinement6
Role & Tools

ROLE:
- UX/UI Designer
- Visual Designer
- Wireframes
- interaction design
- Design system definition
TOOLS:
- Figma
- Google Analytics
- Slack
- Google Meet
Research & Insights
Hierarchy first, scannable design, UI consistency & decision-focused

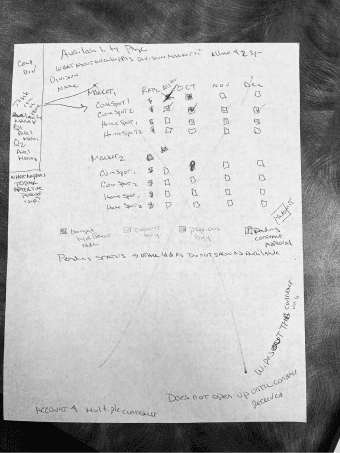
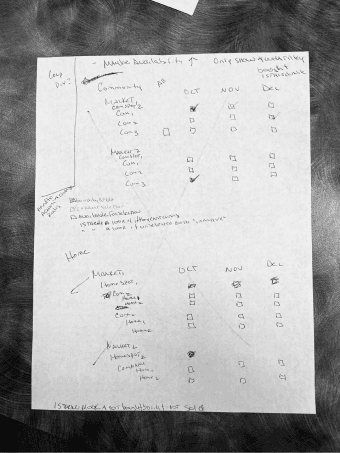
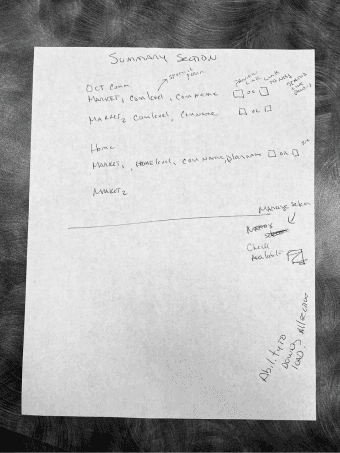
Example - Early wireframes
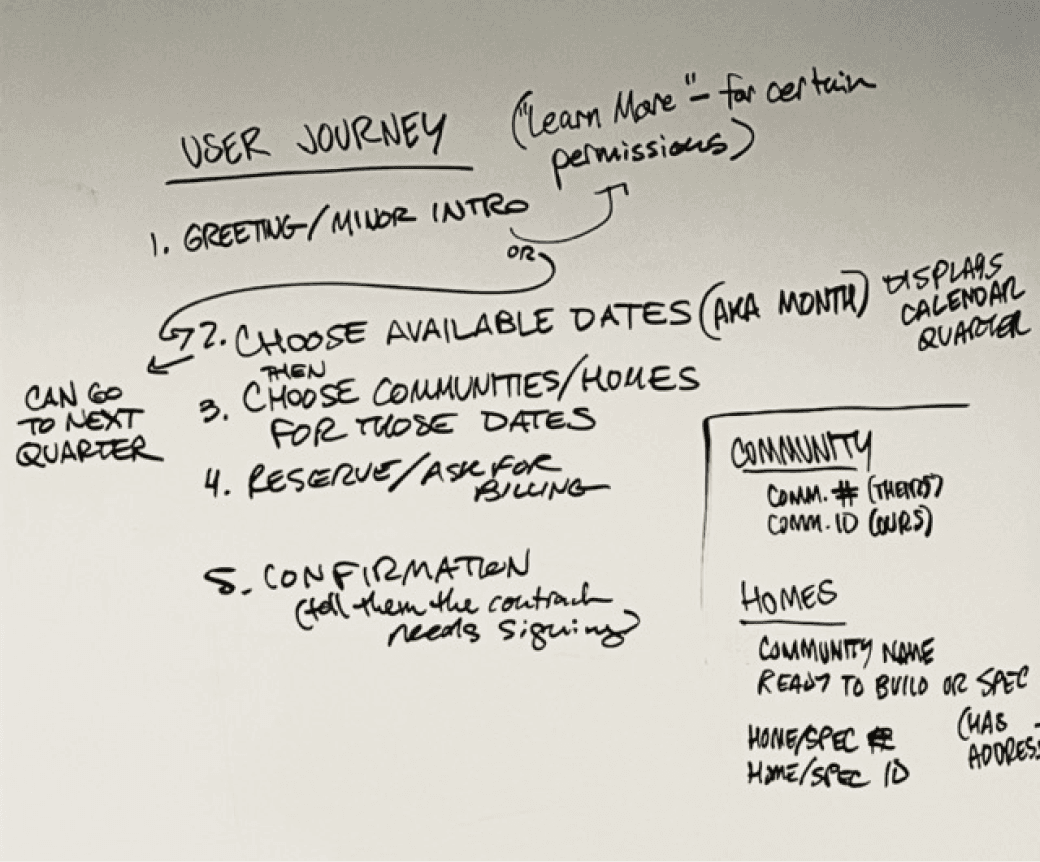
Example User Journey
Constraints
Fixed data structure, large datasets, complex filters, desktop-first long sessions.
Learnings
- Enterprise users value clarity over density
- Visual hierarchy is critical in data products
- Consistency builds trust in complex systems

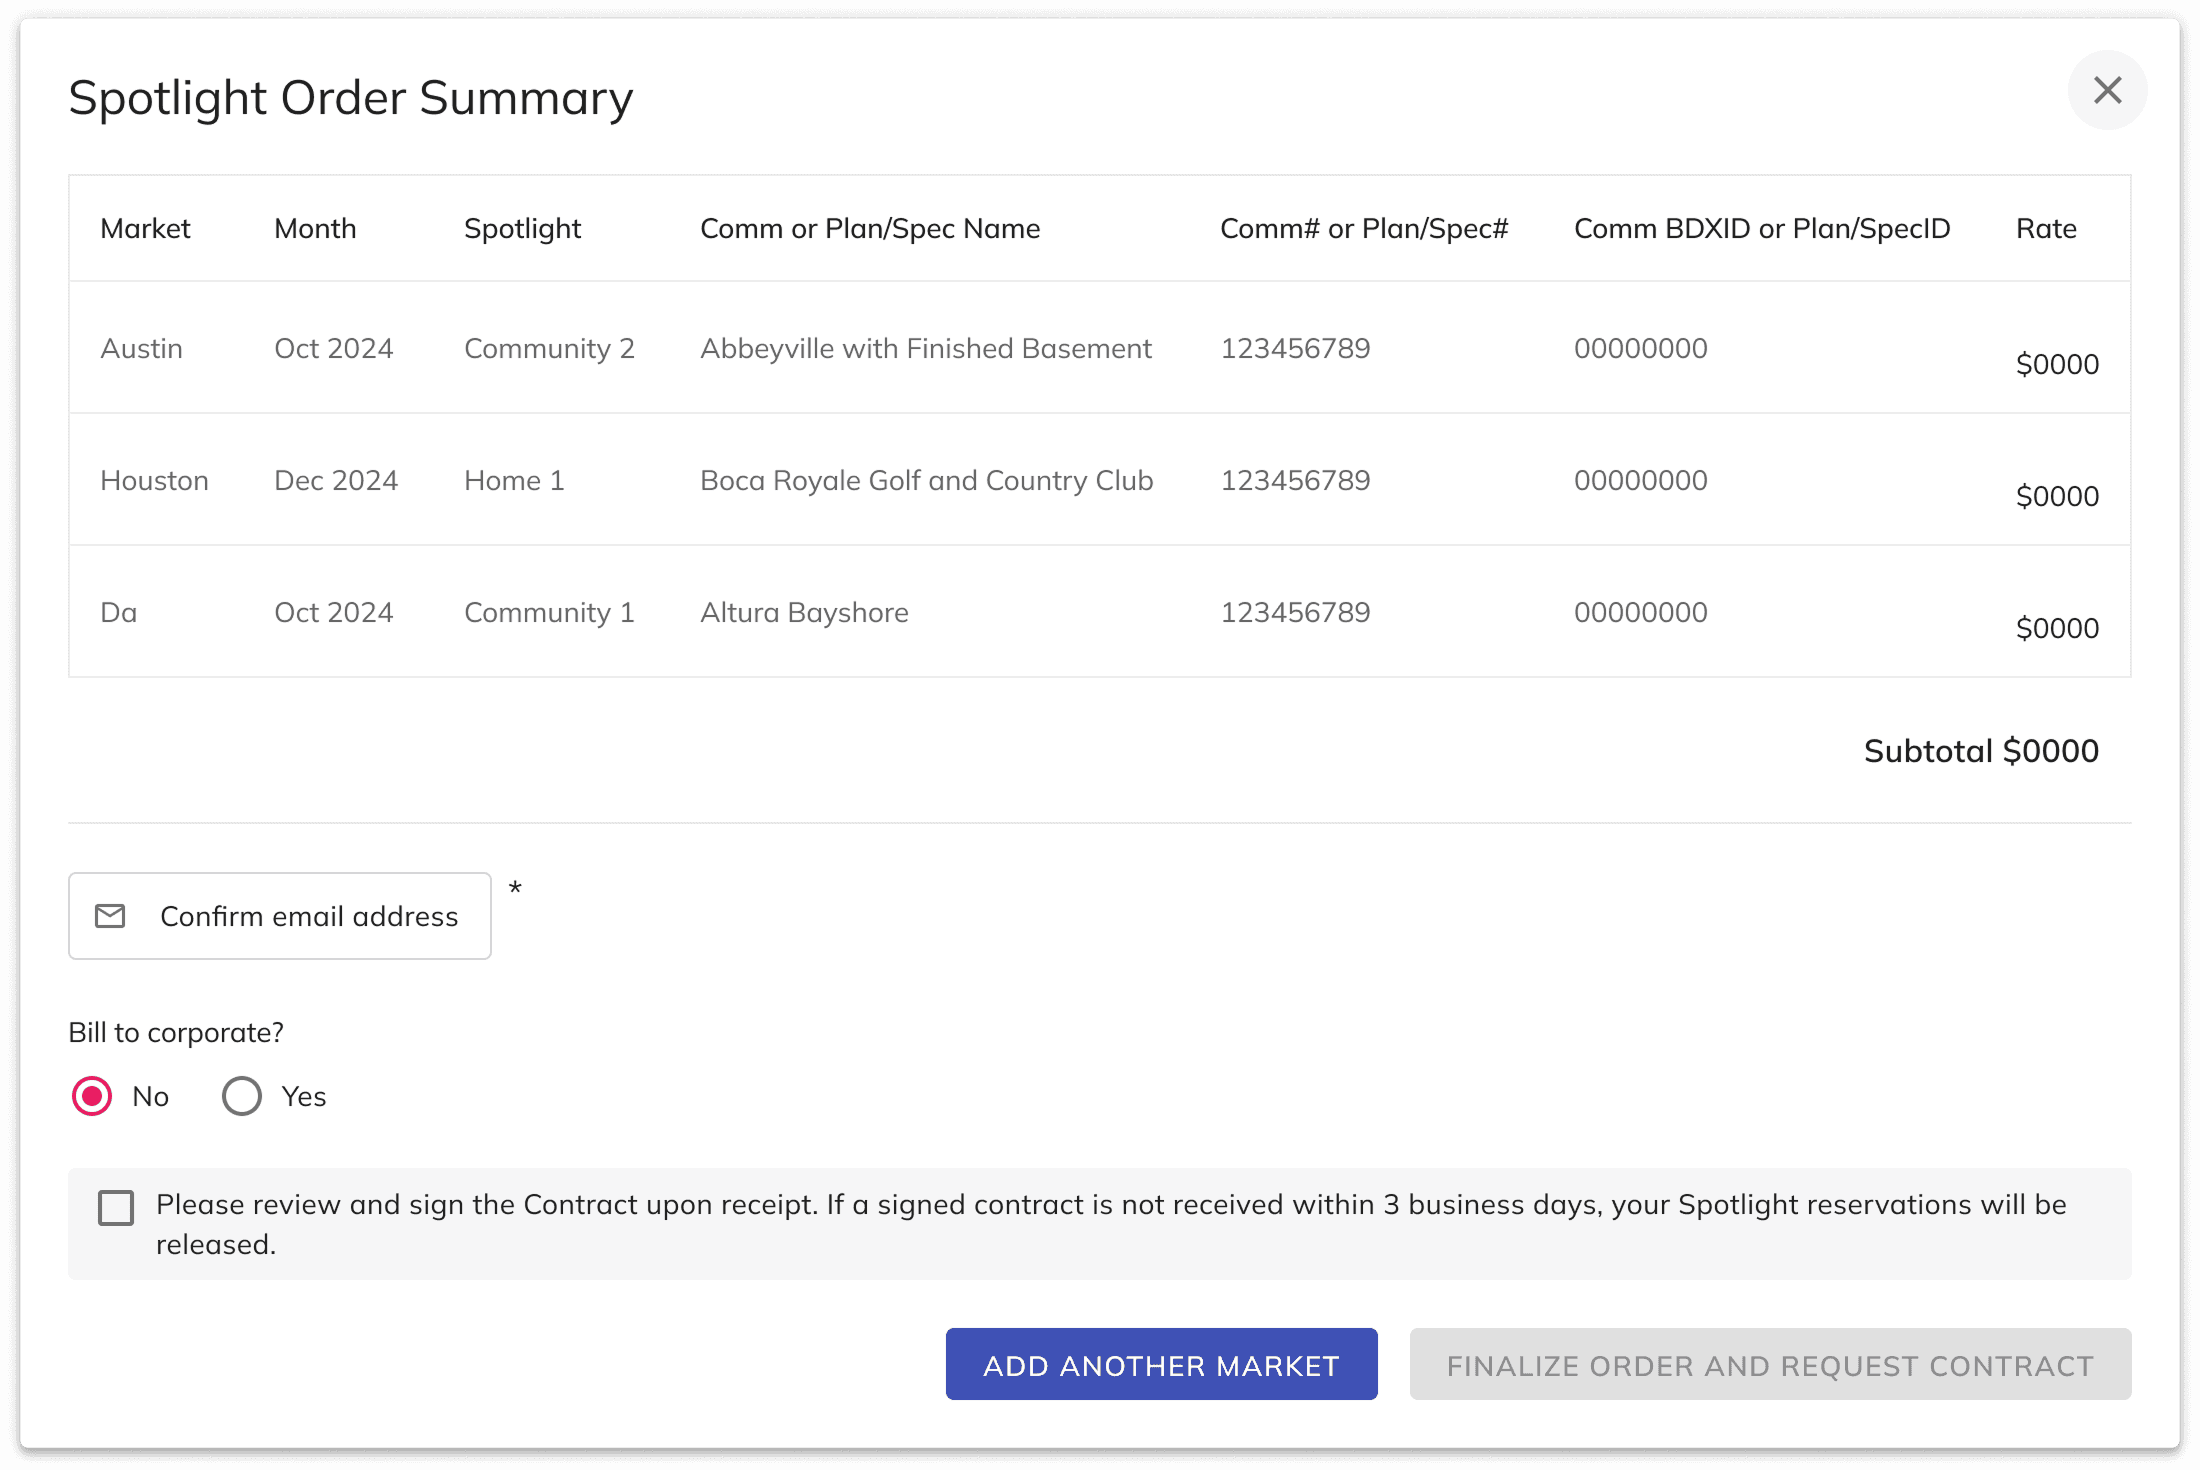
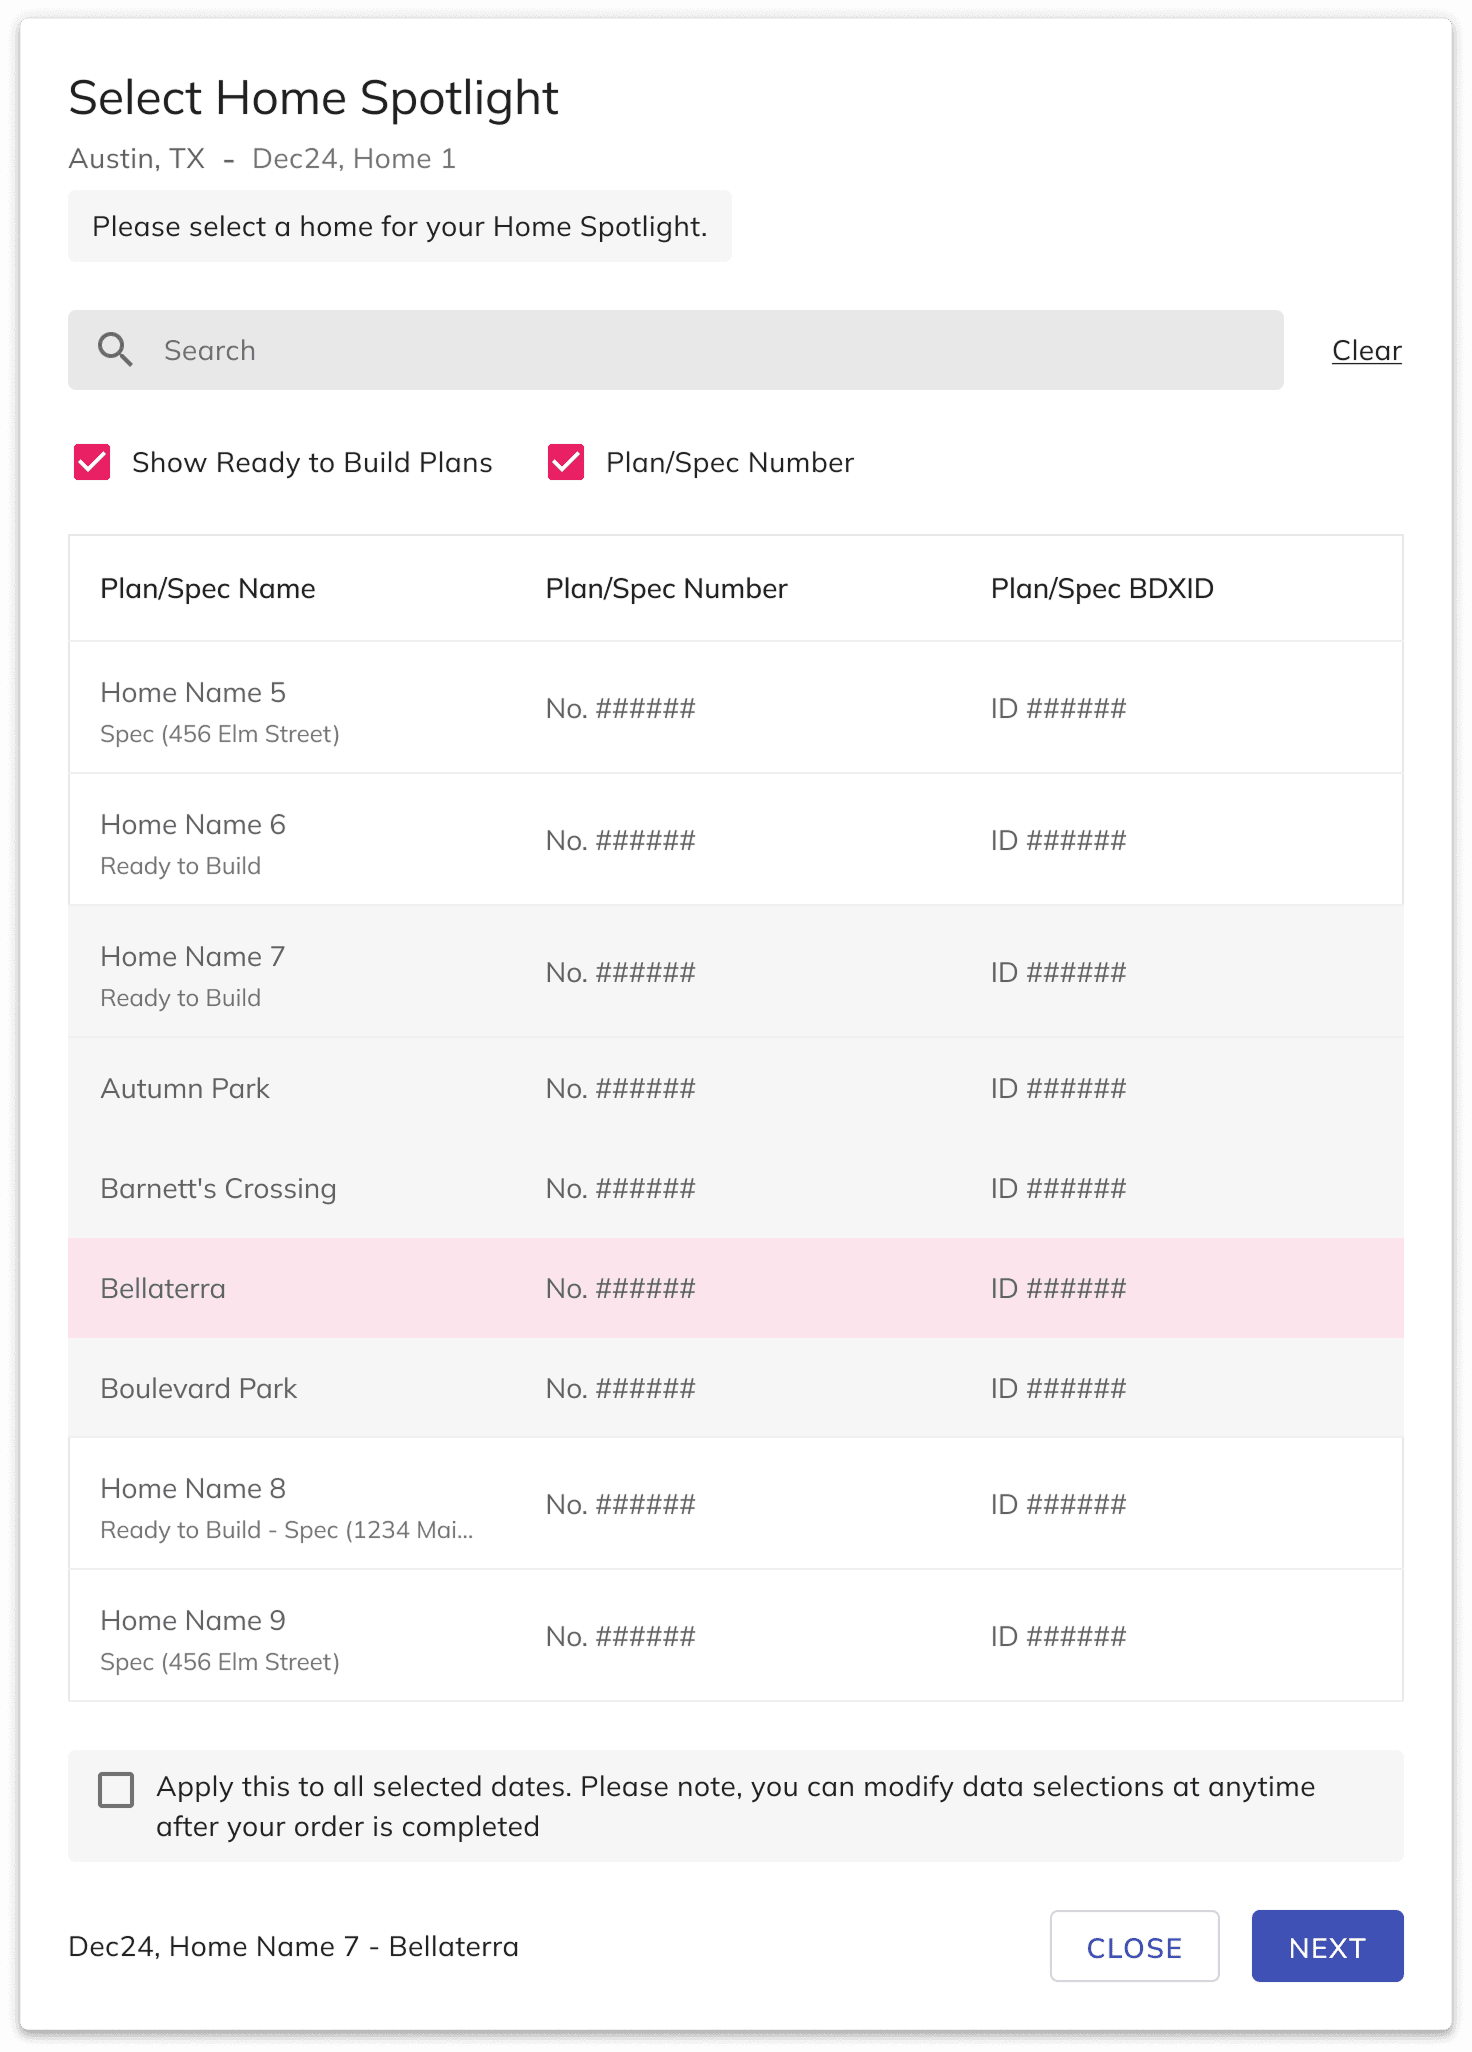
Modals screens